Student-centered Inheritance Investigation: Hands-on & High-rigor
Inheritance and patterns of heredity are central to middle and high school science standards, but they can be hard for students to understand without chances to talk through evidence together. While case studies and pedigrees can introduce key ideas, students develop deeper understanding when they collect data, compare observations, and make sense of results as a scientific community.
In this post, we share a free slide deck designed to support short, collaborative inheritance investigations using Fast Plants seedlings grown in petri dishes as a model organism. Students observe seedlings that are 3–5 days old and collect data based on visible traits. This approach keeps the focus on careful observation and data analysis. Because the petri dish method removes the need for soil or planting time, the investigation can be completed in just 4–5 days using simple lamp lighting, making it easy to use and repeat.
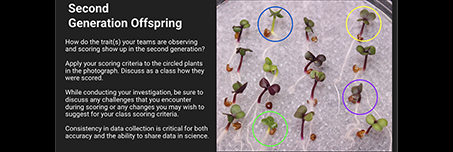
Student discussion is central to this type of investigation. Students work in small groups and share data across the class—or even across multiple classes—to increase the sample size for more reliable analysis. To do this well, students and teachers must agree on what is being observed, how traits are defined, and how observations are recorded. The slide deck is designed to support these conversations, helping students build strong observation skills and understand why shared data collection standards are essential when scientists pool data to find patterns and calculate probabilities.
Note: Learn more about using Fast Plants to teach Mendelian and non-Mendelian inheritance in the post titled Teach Inheritance with Fast Plants – Where to start?
Easily observable Fast Plants traits with Mendelian inheritance patterns
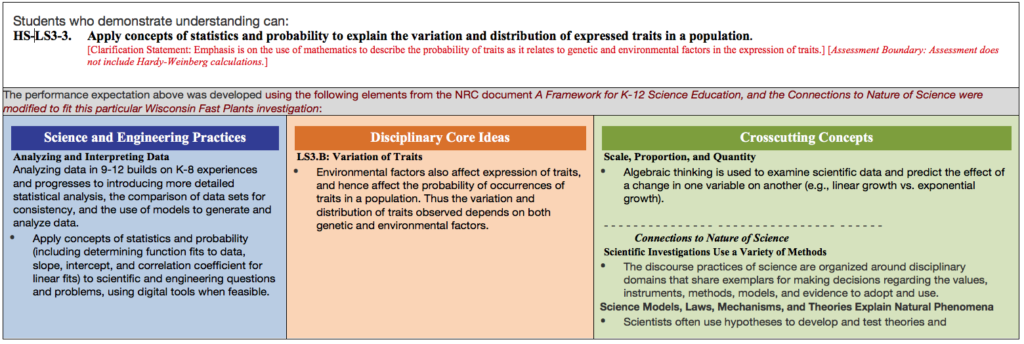
Fast Plants are especially effective for NGSS HS-LS3-3 because they show clear, observable traits that follow Mendelian inheritance, allowing students to collect and analyze real data quickly.
Key traits students can observe include stem color (purple vs. nonpurple), plant form (standard vs. rosette), and leaf color (dark green vs. yellow-green). These traits show clear dominant and recessive patterns that are easy for students to identify and score.
Because parental, F1, and F2 seedstocks are available, students do not need to wait for multiple generations to grow. For example, seeds can be germinated on moist paper towels, and within just three days, students can observe stem color or plant form directly in seedlings. This allows inheritance investigations to fit easily into a short time frame.
Students can then use probability and statistics to compare expected Mendelian ratios with observed results, helping them analyze variation and meet the core expectations of HS-LS3-3 using authentic biological data.
Supporting students to make & record data that can be pooled accurately
When students collect data, it’s easy to think that more data automatically means better results. But that’s only true if everyone is collecting and recording data the same way.
In real science—and in the classroom—researchers often combine data from many people to get a large enough sample size to see patterns or calculate probabilities. This only works when everyone agrees on exactly what is being counted and how it is counted. If one student counts a trait one way and another student uses a different definition, the combined data can become confusing or misleading.
Standardized terminology and clear definitions help solve this problem. Scientists agree ahead of time on what each term means and what qualifies as an observation. That way, when data are pooled, everyone knows the numbers are comparable. The results are more accurate, patterns are easier to spot, and conclusions are more trustworthy.
Teaching students to use shared definitions is more than a classroom management strategy—it’s an authentic scientific practice. It helps students understand why precision matters, prepares them for real data analysis, and shows them how collaboration makes science stronger.
Why Sample Size Matters in Inheritance Investigations
When students study inheritance using their own data, sample size matters. Inheritance patterns are based on probability, and small data sets can easily lead to misleading results. Gregor Mendel understood this and carefully counted hundreds to thousands of plants for each trait he studied. Because of these large sample sizes, his results closely matched expected inheritance ratios.
In a classroom, the effect of small samples is easy to see. Imagine one student group observes only 10 seedlings from a genetics investigation. By chance, they might see 7 plants with one trait and only 3 with another. That result can look like a real pattern, even though it does not reflect the expected ratio. Another group with 10 seedlings might see a very different outcome.
When students combine data from many groups or classes, the total number of observations increases. As the sample size grows, random differences even out and true patterns become clearer. Larger data sets help students understand that inheritance patterns emerge from many observations, not from a single group’s results, and that reliable scientific conclusions depend on collecting enough data.
Resources to Support Student Data Collection with Fast Plants
To support high-quality data collection and shared analysis, the Fast Plants team has developed a set of free, classroom-ready resources for teaching inheritance using Fast Plants as a model organism. Together, these materials help teachers and students use consistent procedures, shared terminology, and clear definitions—essential for combining data across groups and classes.
The resources include a student handout that guides the setup of a petri dish germinations study using Fast Plants seeds. To support accurate observations, two Dihybrid Inheritance Phenotype Guides are provided as slide decks: a Classroom Version for students and a Teacher Version that serves as an answer key and discussion guide, offering suggestions for supporting sensemaking around observed phenotypes. A day-by-day calendar shows the typical timeline for the investigation under stable classroom conditions, helping you plan when observations and data collection are likely to occur. A classroom logistics guide for teachers includes photos and descriptions of setting up and managing petri dish systems. Finally, a Fast Plants genetics decision tree can help—especially if you are new to using Fast Plants—select appropriate seed varieties and growing systems for your instructional goals and classroom constraints.
Together, these resources are designed to make it easier to support careful observation, productive student discourse, and reliable data analysis in inheritance investigations.
All of these resources (and more!) are available through the Wisconsin Fast Plants open-source Google Drive, where you are welcome to copy files to your own drive and then edit/adapt them for your own classroom.
Wisconsin Fast Plant resources are openly licensed under a Creative Commons Attribution NonCommercial-ShareAlike 3.0 License. We continue to make new resources available through support from a variety of grants and projects, and we also support those Fast Plant resources developed over the 35+ years of our program’s activity. Please share your comments and recommendations as you use and refine Fast Plant materials. It is through feedback and collaboration that our resources continue to grow and improve.